Section 1: Foundations of a Modern Measurement Framework
In the contemporary business landscape, the function of marketing has irrevocably shifted from a creative-led cost center to a data-driven engine of growth. Central to this transformation is the adoption of a robust measurement framework. This is not merely a collection of metrics or a dashboard of charts; it is a structured, strategic system designed to assess and quantify the impact of all marketing efforts.1 A well-architected framework provides a single, authoritative source of truth that defines what success looks like for the business, ensuring absolute clarity over how objectives and Key Performance Indicators (KPIs) are measured and segmented.2 Its purpose is to move organizations beyond a disjointed sea of data, where connecting activities to tangible business outcomes is a constant struggle, and toward a state of strategic coherence.3
The development and maintenance of such a framework is not a static project but a dynamic, iterative process. It involves a continuous cycle of goal setting, data collection, analysis, and refinement, ensuring an ongoing and comprehensive evaluation of all marketing activities.1 This adaptability is paramount, as the framework must constantly evolve to keep pace with shifts in technology, market dynamics, and the company’s own strategic objectives.2
1.1 The C-Suite Imperative: Aligning with Business Objectives
The most critical and foundational principle of any effective measurement framework is its direct and unambiguous alignment with overarching business objectives.2 Without this connection, the framework fails its primary purpose: to demonstrate marketing’s contribution to the organization’s value. The process must begin not with the data that is available, but with the outcomes the business needs to achieve. This involves a top-down approach that starts by defining the company’s overarching mission or vision, which then cascades into specific business and marketing objectives.2
This alignment is essential for securing and maintaining executive buy-in. C-suite executives, particularly the CEO and CFO, process information through a financial and strategic lens. They are not interested in the volume of marketing activity but in its impact on business outcomes.6 Research from Harvard Business School underscores this reality, noting that executives form lasting impressions about a department’s strategic competence and alignment within an average of just 23 minutes spent reviewing reports.6 Therefore, a framework that presents data without a clear connection to business priorities actively undermines marketing’s credibility and influence within the organization.6
To achieve this alignment, marketing leaders must learn to speak the language of their executive peers. When communicating with a VP of Sales, the focus should be on lead generation and sales support; for a CFO, it must be on the financial returns from marketing investments and efficient resource allocation.7 This necessitates that all objectives within the framework are SMART: Specific, Measurable, Achievable, Relevant, and Time-bound.1 This rigor transforms marketing from a perceived operational expense into a strategic capital allocation decision with measurable returns.6
1.2 KPIs vs. Vanity Metrics: Separating Signal from Noise
A frequent and critical failure in measurement is the tendency to track what is easily visible rather than what is truly valuable.8 This leads to a focus on “vanity metrics”—superficial indicators like raw impressions, page views, or total follower counts—that often obscure the true performance narrative. To a CEO, these metrics are simply “noise obscuring signal” and do little to prove business impact.6 Current data suggests that 68% of marketing dashboards contain metrics that executives never reference in strategic decisions, highlighting a profound disconnect between what marketing reports and what leadership values.6
An effective framework ruthlessly prioritizes Key Performance Indicators (KPIs) that are directly and causally linked to revenue outcomes. This requires a strategic shift away from vanity metrics toward more substantive indicators of business health. The goal is to measure progress against the metrics that matter most to the business: leads, conversions, and revenue.9
This involves replacing metrics like impressions with KPIs such as:
- MQL-to-SQL Conversion Rate: The percentage of marketing-qualified leads that become sales-qualified leads, measuring the quality of leads passed to the sales team.
- Pipeline Contribution by Campaign: The amount of sales pipeline generated by specific marketing initiatives.
- Customer Acquisition Cost (CAC): The total cost of marketing and sales efforts needed to acquire a new customer.
- Customer Lifetime Value (CLV): The total revenue a business can expect from a single customer account throughout the business relationship.6
The selection of KPIs must be tailored to the specific objective being measured. A clear hierarchy of goals and corresponding metrics provides clarity and focus 10:
- For Brand Awareness: Track metrics like impressions, reach, and follower growth to gauge the expansion of brand visibility.10
- For Lead Generation: Monitor click-through rates (CTR), website visits, and form completions, which indicate audience intent and interest.10
- For Sales and Revenue: Focus on bottom-line metrics like conversion rates, customer acquisition cost (CAC), and, most importantly, Return on Investment (ROI) to demonstrate financial impact.1
1.3 Structuring the Framework: The Funnel and the Hierarchy
To organize these objectives and KPIs into a coherent system, two structural models are essential: the marketing funnel and a hierarchical framework. The marketing funnel provides a logical model of the theoretical customer journey, breaking it down into distinct stages from first contact to the final desired outcome.5 This journey is typically framed in three core stages:
- Awareness: When potential customers first become aware of the brand.
- Consideration: When they actively evaluate the brand’s products or services against competitors.
- Conversion: When they make the decision to purchase.13
This funnel structure allows marketers to map specific KPIs to each stage, providing a clear understanding of how effectively they are moving customers through the journey.
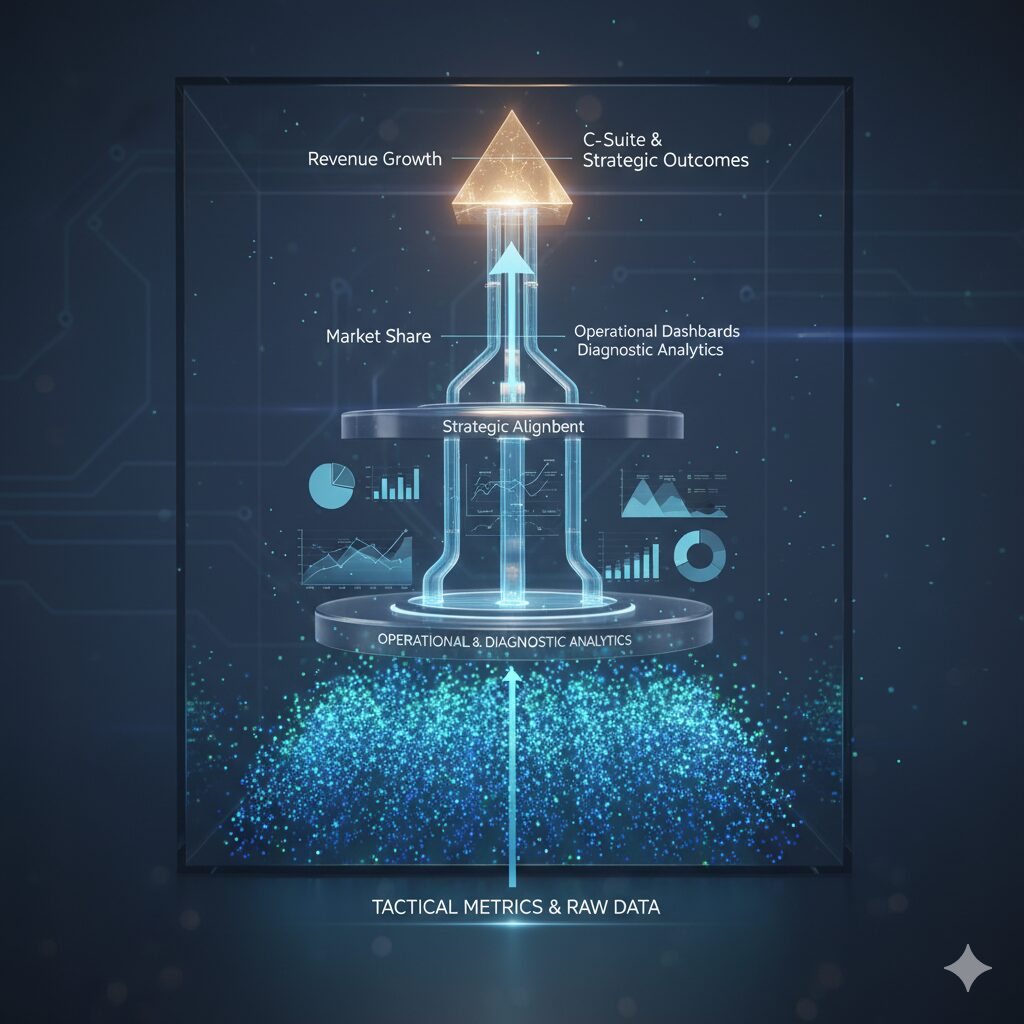
Complementing the funnel is a hierarchical structure for the framework itself. A best-practice framework is not a flat list of metrics but a multi-layered system that provides clarity at different organizational levels.2 This architecture serves as a critical translation layer, resolving the inherent tension between the granular, activity-based metrics needed by campaign managers and the high-level, outcome-based KPIs demanded by the C-suite.
The hierarchy should be structured as follows 2:
- Overarching Business Objectives: Begin with 3-5 distinct, high-level business goals (e.g., “Grow market share in the enterprise segment by 15%”).
- Primary KPIs: For each objective, define the single most important metric that signifies success (e.g., “Pipeline Contribution from Enterprise Campaigns”). This KPI must have a clear target or forecast to provide context.
- Secondary Metrics: These are the supporting, often channel-specific, metrics that influence the primary KPI (e.g., LinkedIn engagement rate, cost per lead, MQL-to-SQL conversion rate). These are the diagnostic levers that marketing managers use to optimize performance.
- Segmentation: Define how the data will be segmented for deeper analysis (e.g., by region, product line, customer demographic).
This hierarchical structure is what allows the framework to serve multiple audiences simultaneously. An executive can view a dashboard showing only the top-level objectives and primary KPIs, getting a clear and immediate picture of marketing’s strategic impact. Meanwhile, a digital marketing manager can drill down into the secondary metrics and segments to diagnose performance issues and optimize campaigns. This structure ensures that tactical activities, like improving a LinkedIn post’s CTR 14, are logically and mathematically connected to strategic outcomes, like increasing the MQL-to-SQL conversion rate, which in turn serves the primary business objective.
Section 2: Designing Actionable Marketing Dashboards
Once a strategic measurement framework is established, the next critical step is to translate it into a suite of actionable marketing dashboards. A dashboard is the primary interface through which the organization interacts with its performance data. Its design and execution can mean the difference between a tool that drives insight and a report that gathers dust. The fundamental purpose of a dashboard is to transform raw data into a clear, actionable command center for strategy, visualizing performance, revealing trends, and empowering data-driven decisions.3 It must be designed not as a comprehensive data dump, but as an exercise in executive communication, where every element is purposefully chosen to answer the fundamental question: “How does this directly impact business growth?”.6
2.1 Principles of Effective Dashboard Design
The creation of a high-impact dashboard is governed by a set of core principles that prioritize clarity, relevance, and user experience.
Focus and Clarity: A dashboard’s power lies in its focus. It should report on marketing performance versus key metrics, signaling to the entire organization what matters most.15 This requires a disciplined approach to metric selection, avoiding the clutter of vanity metrics and concentrating only on the KPIs that are most relevant to the user’s goals.16 The design should be clean and intuitive, making complex data accessible and easy to digest.17
Stakeholder-Centric Design: Dashboards are not a one-size-fits-all solution. They must be meticulously tailored to the specific needs and perspectives of different users.16 This leads to the development of distinct dashboard types:
- Executive or CMO Dashboards: These provide a high-level, strategic overview of marketing’s overall performance. They focus on business-outcome KPIs such as ROI, CAC, CLV, revenue attribution, and pipeline contribution, mirroring the language of financial reporting.6
- Managerial or Operational Dashboards: These offer a more granular view, tailored to specific channels or functions. Examples include digital marketing dashboards, SEO dashboards, PPC campaign dashboards, and social media dashboards. They track the tactical metrics that managers use to optimize day-to-day performance and diagnose issues.19
Application of Design Thinking: The five-stage Design Thinking model—empathize, define, ideate, prototype, and test—provides an ideal methodology for creating new dashboards.15 This process ensures that the dashboard is built from a deep understanding of the business problem it is meant to solve and the needs of its stakeholders. It encourages rapid prototyping and feedback, allowing creators to “fail fast” and iterate quickly towards an effective solution, rather than getting bogged down in a quest for initial perfection.15
2.2 Essential Elements of a High-Impact Dashboard
Beyond general design principles, insights from Harvard Kennedy School’s GovLab on performance dashboards reveal five specific design elements that are critical for transforming data into actionable improvements.22 A truly effective dashboard is not just a reporting tool but an analytical one, designed to guide the user from observation to diagnosis and, ultimately, to action.
- Long Time Horizon: Data should be presented over an extended period—months or quarters, ideally going back at least two years. This allows leaders to easily identify seasonal trends, monitor the long-term impact of strategic changes, and notice when trouble is emerging, rather than overreacting to short-term fluctuations.22
- Benchmarks and Targets: Performance metrics presented in isolation are meaningless. A dashboard must provide context by including a benchmark, target, or reference line.22 This allows users to immediately contextualize performance, gauge success, and determine the urgency of potential interventions. Benchmarks can be based on historical data, industry standards, or pre-defined targets.1
- Meaningful Disaggregation: The dashboard should allow data to be broken down by operationally meaningful subunits, such as individual campaigns, field offices, or customer segments. This helps leaders identify pockets of both high and low performance, enabling them to learn from best practices in one area and provide support to another.22
- Clear Connection to Outcomes: The dashboard should explicitly explain how performance on a given measure matters for client or business outcomes. This reduces information overload by focusing attention on the metrics that matter most and facilitates the design of solutions aimed at producing better outcomes rather than simply ensuring compliance.22
- Guided Discussion and Insights: To bridge the “actionability gap,” the dashboard should include elements that guide interpretation and problem-solving. This can take the form of insightful commentary, annotations that provide context for specific data points, or a list of suggested, solution-focused discussion questions.16 This feature transforms the dashboard from a static report into a catalyst for collaborative learning.
2.3 Data Visualization Best Practices
Effective data visualization is about telling a clear and compelling story with data.16 The choice of visualization should be deliberate and serve the goal of making complex information understandable at a glance.
- Choose the Right Chart Type: The visualization format must match the data and the insight it is intended to convey. Best practices include using line charts to show progress over time, bar charts to compare performance across different categories, pie charts for illustrating simple proportions, and tables when precise numerical values are essential.17
- Use Visual Cues: Employ visual cues like color-coding (e.g., red for underperforming, green for on-target) or icons to instantly highlight performance against predefined targets. This allows users to quickly scan the dashboard and identify areas that require attention.16
- Enable Interactivity and Exploration: Great marketers are curious, and a well-designed dashboard should feed that curiosity.15 The dashboard should be interactive, providing filters, drill-down capabilities, and other features that allow users to explore the data, change perspectives, and answer their own follow-up questions. This self-service analytics capability is crucial; it not only empowers marketers but also frees up valuable data science and analytics talent from answering repetitive, time-consuming questions, allowing them to focus on more strategic challenges.15
By making performance visible, transparent, and explorable, dashboards become more than just reporting tools. They become central to fostering a data-driven culture. When everyone in the organization can see how their work contributes to shared goals, it creates a powerful sense of accountability and democratizes data, empowering team members at all levels to make more informed decisions.2 The strategic implementation of dashboards is therefore a change management initiative, with success measured not just by usage statistics, but by a tangible shift in how decisions are made across the organization.
Section 3: Case Studies in Measurement Excellence and Missteps
The theoretical principles of measurement frameworks and dashboards come to life when examined through the lens of real-world application. Analyzing the successes and failures of different organizations reveals that a measurement framework is not merely a technical artifact but a direct reflection of an organization’s strategic maturity and culture. The following case studies illustrate the stark contrast between frameworks that drive learning and value versus those that produce misleading or irrelevant metrics.
3.1 Best in Class: Spotify’s “Experiments with Learning” (EwL) Framework
Spotify’s approach to measuring experimentation represents a pinnacle of measurement maturity, built on a culture of intellectual honesty and a relentless focus on learning. The “Experiments with Learning” (EwL) framework fundamentally redefines the concept of a “successful experiment”.23
What They Do Well:
- Prioritizing Learning Over Winning: The core of the EwL framework is the shift in focus from simply identifying “winners” (experiments that produce a positive result) to generating trustworthy insights that guide product decisions. This is starkly illustrated by their metrics: Spotify’s “learning rate” is approximately 64%, while their “win rate” is only around 12% in their most active organizations.23 This gap is not seen as a failure but as a success. It demonstrates a culture that values understanding what doesn’t work and detecting regressions just as much as shipping improvements, as this knowledge is crucial for preventing bad product decisions.23
- A Rigorous Definition of “Learning”: Spotify sets a high bar for what constitutes a learning. An experiment only qualifies if it is both technically valid (free of issues like sample ratio mismatches) and produces “decision-ready” results. Decision-ready outcomes are clearly defined as one of three possibilities: a clear success, a clear regression, or a neutral result from a test that was statistically powerful enough to have detected an effect if one existed. Critically, experiments with neutral results that were underpowered are explicitly classified as “no learning,” which enforces a high standard of analytical rigor and prevents teams from drawing conclusions from inconclusive data.23
Key Takeaway: The ultimate purpose of a measurement system should be to generate learning and inform better decisions, not simply to report positive numbers. This requires a profound cultural shift away from celebrating vanity metrics and toward an intellectually honest analysis of all outcomes, including failures.
3.2 Bridging the CX-to-Revenue Gap: The Specialty Insurer Case Study
This case study provides a powerful example of a common measurement misstep: relying on a popular but strategically disconnected metric.
The Problem (A Common Misstep): A large specialty insurance provider had high Net Promoter Scores (NPS), a widely used customer experience (CX) metric. Their scores were even higher than industry peers. However, this apparent success was not translating into revenue growth.24 This situation exemplifies the danger of a framework built around a single, isolated metric that lacks a direct, demonstrable link to core business outcomes. The high NPS score created a false sense of security, while the underlying business remained stagnant.
The Solution: The organization, with the help of consultants, moved to develop a sophisticated, multi-layered CX measurement framework designed to forge a clear connection between customer experience and financial performance.
- Layered Measurement: They architected a three-tiered framework to provide a holistic view of the customer experience, capturing metrics at the transactional (a specific interaction), journey (a series of interactions), and relationship (overall perception) levels.24
- Connecting to Loyalty Drivers: Instead of just measuring general satisfaction, the new framework was built around the specific drivers of member loyalty that had been identified through qualitative and quantitative research. This ensured they were measuring what was mutually important to both customers and the business.24
Key Takeaway: A measurement framework must create a clear and defensible line of sight from operational or channel-level metrics (like NPS) to financial outcomes (like revenue, retention, and profitability). Without this connection, even “good” scores are strategically meaningless and can mask significant business challenges.
3.3 LinkedIn: A Multi-Faceted Approach to Measurement
LinkedIn itself provides a compelling example of how a data-driven, measurement-focused mindset can be applied across an entire organization, not just within the marketing department.
- Internal Operations: In a notable case, LinkedIn partnered with the firm Kaiterra to monitor and optimize the indoor air quality (IAQ) in its office buildings. By installing over 1,000 sensors and analyzing billions of data points, they were able to connect IAQ metrics directly to employee well-being and operational efficiency. This data-driven initiative resulted in a 67% improvement in CO2 levels and a 32% reduction in HVAC runtime, demonstrating a commitment to measurement for optimizing the physical work environment.25
- Core Business Model: LinkedIn’s entire business model is predicated on measurement. The most important activity for the company is platform development aimed at increasing user engagement. This engagement is the core metric that drives the entire ecosystem: more engaged users attract more recruiters and advertisers, who in turn pay for premium access and solutions. The platform’s health and revenue are directly tied to the measurable engagement of its user base.26
- Marketing Solutions for Customers: LinkedIn extends its measurement philosophy to its customers. The LinkedIn Marketing Solutions platform offers deep conversion measurement tools, allowing advertisers to track campaign efficiencies and connect their ad spend directly to business results like leads and conversions.27 This shows that the company not only uses measurement internally but also provides the tools for its clients to build their own robust frameworks.
Key Takeaway: Leading companies embed a measurement mindset into their cultural DNA. It is applied not only to external marketing campaigns but also to internal operations, the core business model, and the products and services offered to customers. This pervasive application of data-driven principles is a hallmark of a truly mature organization.
Section 4: The Measurement Audit: Methodologies for Ensuring Integrity and Performance
A measurement framework is not a static document to be created and then forgotten. It is a living system that requires regular evaluation to ensure its continued accuracy, relevance, and alignment with evolving business goals. A measurement audit is the formal process for conducting this evaluation. It is a thorough, objective assessment of an organization’s marketing strategies and the systems used to measure them.13 The goal is to separate activity from impact, confirm that partnerships and strategies are producing measurable results, and identify opportunities for improvement.9 There are several distinct methodologies for conducting an audit, each with a different focus and purpose.
4.1 Methodology 1: The Data-Foundation Audit (Bottom-Up)
This is a deeply technical audit focused on the integrity, accuracy, and reliability of the data itself. It serves as the bedrock of any measurement system, as strategic insights derived from flawed data are inherently untrustworthy.
Process Steps:
- Audit Current Data Sources: The first step is to create a comprehensive inventory of every platform that collects marketing data across the entire funnel. This includes ad platforms (e.g., Google Ads, LinkedIn), web analytics tools (e.g., GA4), marketing automation systems, and CRM systems (e.g., Salesforce, HubSpot).8
- Identify Inconsistencies: With the data sources mapped, the audit systematically searches for breaks and inconsistencies in the data flow. Common issues include duplicate tracking events, missing or inconsistent UTM parameters that corrupt attribution, and incomplete lead source data within the CRM.8
- Verify Tracking Mechanisms: The audit must confirm that essential tracking tools are implemented correctly. This includes verifying the proper setup of Google Analytics 4, call tracking software, form submission tracking, and the integration between these tools and the CRM. Without this, clean lead attribution is impossible.9
- Review Data Integration: The process of consolidating data from various channels into a central repository or dashboard is reviewed to ensure it is happening accurately and without data loss, providing a truly comprehensive view of performance.1
- Pros: This methodology addresses the root cause of many reporting errors and discrepancies. It builds foundational trust in the data across the organization and is an essential prerequisite for any advanced analysis or strategic decision-making.
- Cons: It is a highly technical and resource-intensive process requiring specialized skills. While it can identify that data is broken, it does not address whether the organization is measuring the right things from a strategic perspective.
4.2 Methodology 2: The Strategic Performance Audit (Top-Down)
This audit takes the opposite approach, starting with business strategy and working down to evaluate the framework’s alignment and effectiveness. It answers the critical questions: “Are we measuring what truly matters to the business?” and “Are our efforts driving the desired results?”
Process Steps:
- Define Scope and Objectives: The audit begins by clarifying the top-line business objectives and what the audit itself hopes to achieve. This could be a broad review of all marketing activities or a focused analysis of a specific area like digital marketing or brand positioning.28
- Review Tangible Business Outcomes: The core of this audit is drawing a straight, defensible line between marketing activities and tangible business outcomes like qualified leads, sales conversions, and revenue. Reports filled with vanity metrics are a major red flag; the focus must be on metrics the sales team and executive leadership would recognize as valuable.9
- Conduct External Analysis and Benchmarking: Performance is evaluated not in a vacuum but against the external market. This involves researching competitor strategies and benchmarking key metrics, such as Cost-Per-Qualified-Lead (CPQL), against industry standards. This external context is crucial for understanding true performance, as internal year-over-year comparisons can mask stagnation.9
- Perform a SWOT Analysis: Based on the internal and external analysis, a formal SWOT (Strengths, Weaknesses, Opportunities, Threats) analysis is conducted. This provides a structured way to synthesize findings and identify strategic priorities.28
- Evaluate Strategic Adaptability: A static strategy is a failing strategy. This step reviews how often the marketing plan is meaningfully updated. A proactive, high-performing team should be constantly testing new approaches, adjusting bids, and optimizing campaigns based on changing market conditions.9
- Pros: This methodology directly connects measurement to business value and ensures the framework remains strategically relevant and forward-looking. It is highly effective at identifying competitive gaps and strategic opportunities.
- Cons: It carries the risk of producing strategically sound recommendations that are based on flawed or inaccurate data if a foundational audit is not also performed.
4.3 Methodology 3: The Holistic Process Audit (360-Degree View)
This is the most comprehensive type of audit, examining the entire ecosystem surrounding the measurement framework, including people, processes, and technology. It uses a structured approach, such as the “6Ms” framework from quality management, to provide a 360-degree view and identify systemic issues.
Process Steps (based on the 6Ms framework 29):
- Man (People): This evaluates the human element. Do team members have the necessary skills and training in data analysis and analytics tools? Is there a collaborative, cross-functional team responsible for the framework, including members from Sales, IT, and Finance?.1
- Machine (Technology): This assesses the technology stack. Are the analytics tools, CRM, and other MarTech platforms configured correctly and being used to their full potential?.1
- Method (Process): This reviews the documented processes. Does the official measurement framework document align with what is being done in practice? Are standard operating procedures (SOPs) current? Has the most appropriate attribution model been selected and implemented correctly?.1
- Material (Inputs): This examines the raw inputs to the system. Is the data being fed into the system from various sources correct, complete, and traceable? Are there known issues with data quality from third-party providers?.29
- Measurement (Data & Monitoring): This looks at the act of measurement itself. Is there a clear data collection plan? Is performance being actively monitored against KPIs, and are trends being analyzed?.29
- Mother Nature (Environment): This considers the external context. Are there market shifts, new regulations (e.g., data privacy), or other external factors that could impact the measurement process?.29
- Pros: This is the most thorough and comprehensive audit methodology. It is exceptionally effective at identifying deep-seated, systemic issues that might be missed by audits focused solely on data or strategy. It fosters a culture of continuous process improvement.
- Cons: It can be highly complex, time-consuming, and may be considered overkill for smaller or less mature organizations.
Comparison of Audit Methodologies
The selection of an audit methodology depends on the organization’s specific needs, maturity, and the challenges it faces. The table below summarizes the three approaches to aid in this decision-making process.
| Methodology | Primary Focus | Key Activities | Pros | Cons | Best For |
| Data-Foundation Audit | Technical Data Integrity | Data source mapping, inconsistency detection, tracking verification, integration review. | Fixes root causes of reporting errors; builds trust in data. | Technical, resource-intensive; doesn’t assess strategic relevance. | Organizations with low trust in their data or experiencing frequent reporting discrepancies. |
| Strategic Performance Audit | Business & Strategy Alignment | Reviewing business outcomes, external benchmarking, SWOT analysis, evaluating adaptability. | Directly connects measurement to business value; identifies competitive gaps. | Can produce recommendations based on flawed data if a foundation audit isn’t done. | Teams needing to prove ROI to leadership or realign marketing strategy with business goals. |
| Holistic Process Audit | Entire Measurement Ecosystem | Analysis of People (Man), Technology (Machine), Process (Method), Inputs (Material), Data (Measurement), and Environment (Mother Nature). | Most comprehensive; identifies systemic issues; fosters continuous improvement. | Highly complex and time-consuming; may be overkill for smaller organizations. | Mature organizations seeking to optimize their entire measurement system for peak performance and efficiency. |
Section 5: The Cutting Edge: AI and Predictive Analytics in Measurement
The field of marketing measurement is undergoing a fundamental transformation, driven by advancements in artificial intelligence (AI) and predictive analytics. These technologies are rapidly evolving measurement frameworks and dashboards from reactive, historical reporting tools into proactive, forward-looking engines for strategic decision-making and growth. Organizations that master these capabilities will gain a significant competitive advantage.
5.1 The AI-Powered Dashboard: From Visualization to Conversation
The next generation of marketing dashboards is infused with AI, fundamentally changing how users interact with and derive value from data.
Automated Insights: Instead of simply presenting charts and graphs, AI-driven dashboards can now automatically analyze performance data, identify significant trends and anomalies, and deliver key insights in natural, human-readable language.31 For example, the AI Insights feature from the reporting tool DashThis allows a user to, with a single click, receive a summary of campaign “wins, issues, and opportunities.” This capability dramatically accelerates the time from data to decision by eliminating the need for manual analysis and guesswork.32
Democratizing Data with NLP: AI, particularly through Natural Language Processing (NLP), is making sophisticated data analysis accessible to non-technical users. NLP can translate complex data findings into concise, comprehensible reports, while other algorithms can automatically recommend the most effective visualization format for a given dataset.31 This removes barriers to entry, empowering more people across the organization to engage with data and fostering a more deeply embedded data-driven culture.16
The Rise of Agentic AI: The cutting edge is moving beyond conversational AI toward “Agentic AI.” While conversational AI can answer questions about data, agentic AI can take the next step by performing tasks and acting on the data, further closing the loop between insight and execution and revolutionizing the entire marketing data workflow.33
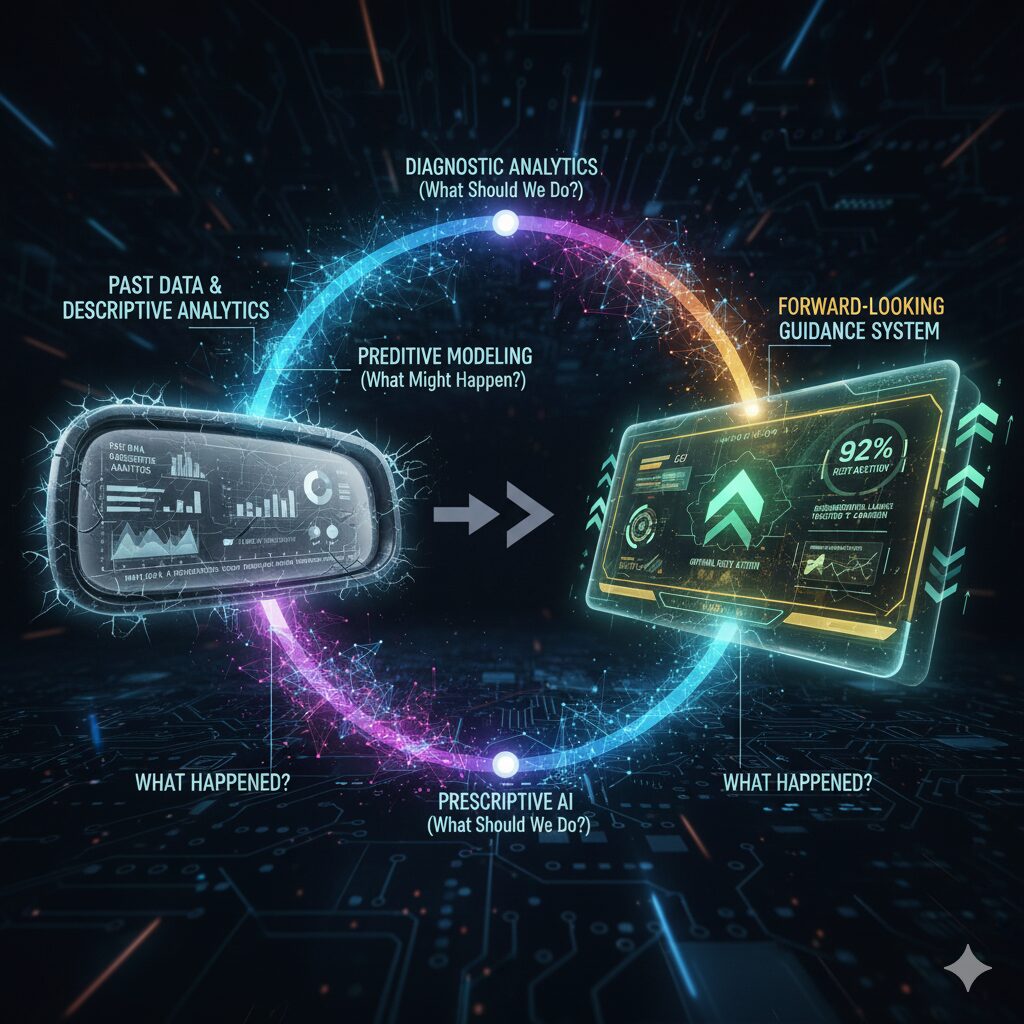
5.2 The Analytics Maturity Curve: From “What Happened?” to “What Should We Do?”
As outlined in materials from Harvard Business School, the application of data analytics in business can be understood as a maturity curve with four distinct stages.34
- Descriptive Analytics: Answers the question, “What happened?” This is the realm of standard historical reporting.
- Diagnostic Analytics: Answers the question, “Why did this happen?” This involves root cause analysis to understand the drivers behind the trends seen in descriptive analytics.
- Predictive Analytics: Answers the question, “What might happen in the future?” This stage uses historical data to forecast future trends and events.
- Prescriptive Analytics: Answers the question, “What should we do next?” This is the most advanced stage, which recommends an optimal course of action to achieve a specific goal.
While most organizations operate primarily in the descriptive and diagnostic stages, the true source of sustained competitive advantage lies in mastering predictive and prescriptive analytics.36
5.3 Predictive Analytics in Practice
Predictive analytics is the process of using historical data, combined with statistical models, machine learning, and AI, to forecast future outcomes.34 The workflow typically involves defining a clear problem, acquiring and cleaning the relevant data, developing and training predictive models (such as regression analysis, decision trees, or neural networks), and then validating and deploying the results.37
Examples from HBS Case Studies:
- Marketing: A company can use a customer’s historical behavioral data (e.g., content downloads, email opens, page views) to build a model that predicts their likelihood of converting into a paying customer. This allows for highly efficient and targeted marketing, such as serving specific ads only to leads with a high probability of purchase.34
- Finance: By analyzing historical financial statements and broader industry data, a business can use predictive analytics to forecast future sales, revenue, and expenses, providing a clearer picture of the company’s future financial health.34
- Operations: The hotel and casino operator Caesars Entertainment developed a multiple regression model to predict the number of hotel check-ins on any given day. This model considered factors like historical arrival patterns and local events, enabling the company to optimize staffing levels, thereby reducing costs from overstaffing while protecting the customer experience from the effects of understaffing.34
5.4 The Final Frontier: Prescriptive Analytics
Prescriptive analytics has been called “the future of data analytics” because it moves beyond prediction to recommendation.35 It uses data to determine an optimal course of action by considering all relevant factors and yielding recommendations for the best next steps.
How It Works: Machine learning algorithms are essential to prescriptive analytics, as they can parse through vast quantities of data and complex scenarios far more efficiently than a human can. The algorithms use “if-then” logic to comb through data and make recommendations based on a desired outcome.35 For example, after a predictive model scores a lead based on their likelihood to convert, a prescriptive model could recommend the specific next action with the highest probability of success, such as “enroll in email nurture sequence A” or “assign immediately to a senior sales representative”.35
A ubiquitous example of prescriptive analytics in action is the content recommendation engine on platforms like TikTok. The platform’s algorithm analyzes a user’s past viewing behavior (descriptive), infers their interests (diagnostic), predicts what they are most likely to watch next (predictive), and then serves them that specific content to maximize engagement (prescriptive).35
The adoption of these advanced analytical capabilities has profound implications for the measurement framework itself. As an organization matures along the analytics curve, its framework must evolve from a static system for tracking historical outputs into a dynamic one designed to accommodate predictive inputs. New KPIs become necessary—for example, measuring the accuracy of the predictive models or the ROI of the prescriptive actions taken. This fundamentally shifts the framework’s role from a rear-view mirror to a forward-looking guidance system. Furthermore, the push to leverage these powerful AI technologies creates an undeniable business case for resolving foundational data issues. You cannot build reliable predictive models on messy, inconsistent, or siloed data. As such, the desire to implement AI acts as a “stress test” for a company’s data foundations, providing the strategic leverage needed to fund and prioritize the critical but often-overlooked work of data hygiene, integration, and governance.33
Section 6: Executive Summary and Strategic Recommendations
This report has provided an exhaustive analysis of marketing measurement frameworks and dashboards, moving from foundational principles to the cutting edge of AI and predictive analytics. The core thesis is that a modern measurement framework is not a passive reporting mechanism but an active, strategic tool for aligning marketing with business value, driving data-informed decisions, and securing a competitive advantage.
6.1 Executive Summary
An effective measurement framework is a structured system that provides a single source of truth for an organization’s marketing performance. Its primary function is to translate marketing activities into the language of the C-suite—revenue, profitability, and growth—by rigorously aligning all metrics with overarching business objectives. This requires a disciplined focus on Key Performance Indicators (KPIs) that measure business outcomes, such as Customer Acquisition Cost and Lifetime Value, while avoiding superficial vanity metrics.
Actionable dashboards are the critical interface for this framework. Best practices in dashboard design demand a stakeholder-centric approach, where high-level executive dashboards focus on strategic impact, and granular operational dashboards support tactical optimization. The most effective dashboards are designed not just for information display but for action, incorporating elements like long-term trends, benchmarks, and guided insights to facilitate collaborative problem-solving.
Analysis of leading companies like Spotify reveals that measurement maturity is a reflection of corporate culture. A culture that values learning from failure and demands intellectual honesty is a prerequisite for a world-class measurement system. To ensure the framework’s continued integrity and relevance, a regular cadence of audits is essential. Methodologies range from technical data-foundation audits to top-down strategic performance reviews, allowing organizations to select the approach that best fits their needs.
Finally, the future of measurement is being reshaped by AI and predictive analytics. These technologies are transforming dashboards into conversational, insight-generating tools and enabling organizations to move from reactive analysis of what happened to proactive, prescriptive recommendations about what to do next. Mastering these capabilities requires a robust and clean data foundation, making data governance a strategic imperative.
6.2 Strategic Recommendations
To implement a world-class measurement framework that drives tangible business results, organizations should adopt the following strategic recommendations:
- Begin with the C-Suite: Do not start by aggregating available data. Initiate the framework development process with in-depth interviews of executive stakeholders to define what value and success look like from their perspective. This ensures top-down alignment from the outset.
- Architect a Hierarchical Framework: Design a multi-layered framework that creates a clear, logical connection between high-level business objectives and primary KPIs at the top, and the granular, secondary metrics used for operational optimization at the bottom. This structure serves as a vital translation layer between strategic and tactical teams.
- Design for Action, Not Just Information: Build dashboards that provide context (benchmarks, historical trends) and guidance (annotations, AI-driven key takeaways). The goal is to bridge the gap between data and decision, empowering users to move from observation to action.
- Foster a Culture of Learning: Champion a “learning” mindset, as exemplified by Spotify, where understanding failures and inconclusive results is valued as highly as celebrating successes. This encourages experimentation and intellectual honesty, which are the cornerstones of continuous improvement.
- Implement a Cadence of Audits: Treat the framework as a dynamic system, not a one-time project. Establish a regular schedule of audits—for instance, an annual Strategic Performance Audit to ensure alignment and a bi-annual Data-Foundation Audit to maintain data integrity.
- Prepare for the Predictive Future: Make data hygiene, integration, and governance a top priority today. These foundational elements are the non-negotiable prerequisites for leveraging the transformative power of AI, predictive, and prescriptive analytics. Investing in a clean data foundation is an investment in future competitive advantage.
Sources
- How to Create Marketing Measurement Framework? – Analytico, accessed September 25, 2025, https://www.analyticodigital.com/blog/create-marketing-measurement-framework
- Doing Measurement Frameworks The Right Way – PMG – Digital Marketing Company, accessed September 25, 2025, https://www.pmg.com/blog/doing-measurement-frameworks-the-right-way
- 8 Marketing Dashboard Examples to Track in 2025 – Cometly, accessed September 25, 2025, https://www.cometly.com/post/marketing-dashboard-examples
- What are Marketing Dashboards and Why Do They Matter for Marketing Departments?, accessed September 25, 2025, https://www.sorenkaplan.com/what-are-marketing-dashboards-and-why-do-they-matter-for-marketing-departments/
- Full Social Media Measurement Framework – User Guide – AMEC, accessed September 25, 2025, https://amecorg.com/social-media-measurement-framework-user-guide/full-smmf-guide/
- Marketing Dashboard Design: KPIs That Actually Matter to CEOs, accessed September 25, 2025, https://winsomemarketing.com/winsome-marketing/marketing-dashboard-design-kpis-that-actually-matter-to-ceos
- Marketing Dashboard Best Practices | Demand Metric Blog, accessed September 25, 2025, https://blog.demandmetric.com/2008/08/06/marketing-dashboard-best-practices
- Marketing Measurement Framework: A Complete Guide for 2025, accessed September 25, 2025, https://www.eliya.io/blog/marketing-measurement/measurement-framework
- How To Audit Your Current Marketing Agency | 321 Web Marketing, accessed September 25, 2025, https://www.321webmarketing.com/blog/how-to-audit-your-current-marketing-agency/
- LinkedIn analytics: The complete guide for tracking metrics in 2025 | Sprout Social, accessed September 25, 2025, https://sproutsocial.com/insights/linkedin-analytics/
- 6 Essential KPIs to Measure Success on LinkedIn – Double Play Agency, accessed September 25, 2025, https://doubleplayagency.com/6-essential-kpis-to-measure-success-on-linkedin/
- Content Marketing Metrics To Build A Framework For Success – BrightEdge, accessed September 25, 2025, https://www.brightedge.com/blog/measure-content-success
- How to Conduct a Digital Marketing Audit, accessed September 25, 2025, https://online.hbs.edu/blog/post/digital-marketing-audit
- 10 Best LinkedIn Metrics That Matter for Building a Strong Community – Measure Studio, accessed September 25, 2025, https://www.measure.studio/post/best-linkedin-metrics
- Marketing Dashboards: The Do’s and Don’ts – Tableau, accessed September 25, 2025, https://www.tableau.com/learn/whitepapers/marketing-dashboards-dos-donts
- Marketing Analytics Dashboards: Benefits and Best Practices – Swydo, accessed September 25, 2025, https://www.swydo.com/blog/marketing-analytics-dashboards-benefits/
- How to build client marketing dashboards – AgencyAnalytics, accessed September 25, 2025, https://agencyanalytics.com/blog/build-client-marketing-dashboards
- Best marketing dashboard examples and types with tips on making your own – Selzy, accessed September 25, 2025, https://selzy.com/en/blog/marketing-dashboard-examples/
- 17 Marketing dashboard examples based on real companies – Geckoboard, accessed September 25, 2025, https://www.geckoboard.com/dashboard-examples/marketing/
- Marketing Dashboard: 25 Best Templates for 2025 – Improvado, accessed September 25, 2025, https://improvado.io/blog/12-best-marketing-dashboard-examples-and-templates
- 80+ Dashboard Examples to Inspire Your Client Reporting – AgencyAnalytics, accessed September 25, 2025, https://agencyanalytics.com/blog/dashboard-examples
- Five Elements to Include in Every Performance Dashboard, accessed September 25, 2025, https://govlab.hks.harvard.edu/insight/five-elements-to-include-in-every-performance-dashboard/
- Beyond Winning: Spotify’s Experiments with Learning Framework …, accessed September 25, 2025, https://engineering.atspotify.com/2025/9/spotifys-experiments-with-learning-framework
- Building a CX Measurement Framework – Andrew Reise, accessed September 25, 2025, https://www.andrewreise.com/resources/building-a-cx-measurement-framework-case-study
- Case Study: How Kaiterra Partnered with LinkedIn to Enhance …, accessed September 25, 2025, https://learn.kaiterra.com/en/resources/case-study-kaiterra-linkedin
- LinkedIn Business Model Canvas Case Study – YouTube, accessed September 25, 2025, https://www.youtube.com/watch?v=kATI72tpknI
- Deeper conversion measurement on LinkedIn provides greater campaign efficiencies, accessed September 25, 2025, https://www.casestudies.com/company/linkedin-marketing-solutions/case-study/deeper-conversion-measurement-on-linkedin-provides-greater-campaign-efficiencies
- How to Grow Your Business With a Marketing Audit – Harvard Media, accessed September 25, 2025, https://www.harvardmedia.com/blog/marketing-audit
- The Process Audit Framework – Quality Concepts Matter, accessed September 25, 2025, https://qualityconcepts.home.blog/2020/02/28/the-process-audit-framework/
- Insights On Marketing, Sales & CX Ops | The Agency Auditor Blog, accessed September 25, 2025, https://theagencyauditor.com/blogs/
- Transforming Business Analytics With AI-Driven … – DiGGrowth, accessed September 25, 2025, https://diggrowth.com/blogs/analytics/ai-driven-reporting-and-dashboards/
- DashThis: Marketing Reporting Dashboards For Analytics, SEM & SEO, accessed September 25, 2025, https://dashthis.com/
- Marketing Analytics Blog – Adverity, accessed September 25, 2025, https://www.adverity.com/blog
- What Is Predictive Analytics? 5 Examples | HBS Online, accessed September 25, 2025, https://online.hbs.edu/blog/post/predictive-analytics
- What Is Prescriptive Analytics? 6 Examples | HBS Online, accessed September 25, 2025, https://online.hbs.edu/blog/post/prescriptive-analytics
- How Can Predictive and Prescriptive Data Analysis Help Business Leaders Make the Right Decisions? – Radford University Online, accessed September 25, 2025, https://online.radford.edu/degrees/business/mba/business-analytics/predictive-and-prescriptive-data-analysis/
- What is predictive analytics and how does it work? | Google Cloud, accessed September 25, 2025, https://cloud.google.com/learn/what-is-predictive-analytics
Leave a Reply